
Marketing Analysis Project
市场分析案例
This is part of the final project in MAR 653 Marketing Analysis course instructed by Professor Amiya K. Basu at Syracuse University. This project contains survey research, managing and synthesizing data from multiple sources, and decision making including regression analysis, cluster and conjoint analysis, etc.
This is a group project conducted by Beca Qian, Brian Christopher Lambert, Isabella Cooper, Justin Saxe, and Qingkun Zhu.
High-movement Dominicks:
Sport Drinks
The initial data we used are the data for high-movement sport drinks from the Dominicks database and the Demo Small data for the limited store demographics included in the worksheet of DEMOSMALL. And after the process of data preparation, we selected three brands that were ALL SPORT FRUIT PUNC (ASFP), ALL SPORT LEMON LIME (ASLL), and POWERADE FRUIT PUNCH (PFP).
-
1. How does the demand for a brand depend on price? What is the price elasticity of demand of a brand? Is price elasticity different for different brands?
2. How does demand depend on whether the product is on sale? Is this dependence same for all brands?
3. What brand and what season have the highest probability of being on sale?
4. Are ASLL and PFP equally likely to be on sale at 99% confidence?
-
1. As the price of a brand goes up, the demand drops. The price elasticity is different for each brand. ASFP and ASLL were similar in price elasticity at -1.92, whereas PFP was more negatively elastic at -2.98.
2. Sales have an impact on demand. The sales variable had a low P-Value at the 95% confidence interval indicating significance. However, the overall model has a very low R squared which should be accounted for. When adding dummy variables for each brand, it was concluded that brand ASFP is the only brand that sees a decrease in demand when items are on sale.
3. With the season staying constant, the brand with the highest probability of being on sale is ASFP. In addition, the season with the highest probability of a brand on sale is the winter.
4. At a 99% confidence interval, ASLL and PFP are equally likely to be on sale.
DATA PREPARATION
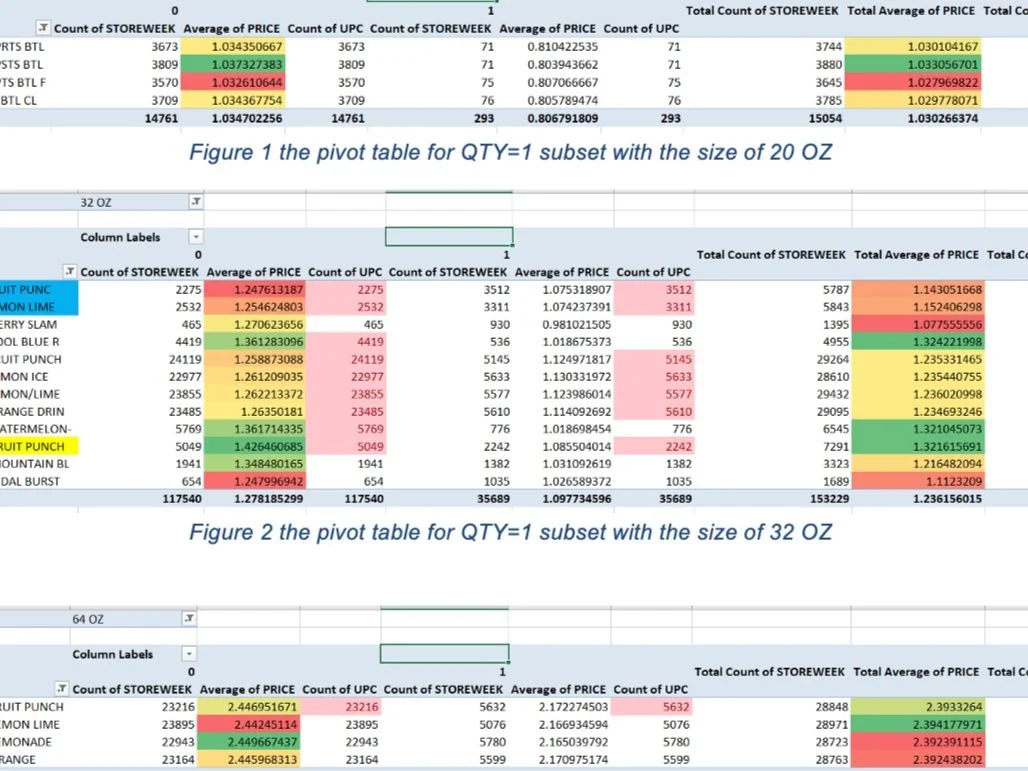
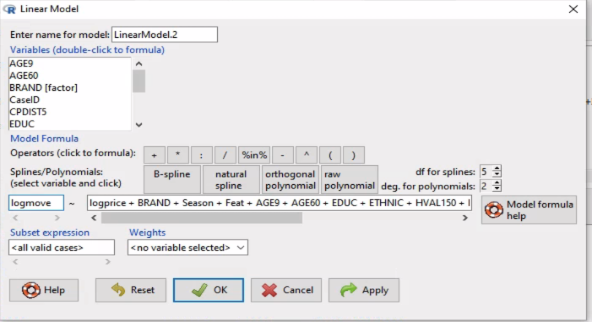
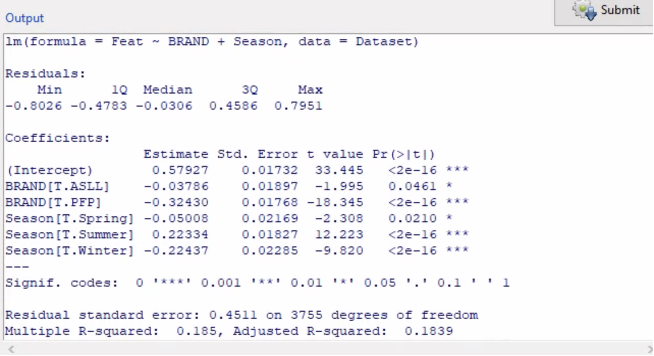
In the first step, we would like to select the raw data for the three brands such that two are of the same price category (high or low), and the third is of the other type. It was essential to make sure the package size (QTY, indicates the size of the bundle) is the same for all three brands. So, we divided the data for high-movement sport drinks into two subsets by QTY=1 and QTY=2. Then, for each subset, we used pivot tables to find average prices for the brands for Feat = 0 and Feat = 1, and total counts of cases. Filtered by the sizes of 20OZ, 32OZ, and 64OZ, the pivot tables for QTY=1 subset are shown in the following figures.
DATA ANALYSIS
Q1: How does the demand for a brand depend on price? What is the price elasticity of demand of a brand? Is price elasticity different for different brands?
According to the calculations, The price elasticity respectively for ASLL, PFP, and ASFP are -1.925382, -2.981695, -1.925382. Therefore, we conclude that as the price of a brand goes up, the demand drops. The price elasticity is different for each brand.
Q2: What brand and what season have the highest probability of being on sale?
The probability of being on sale is different for each season and brand. The highest probability for a brand on sale is during the winter. Spring is the second highest season to most likely be on sale, Fall is the third most likely season to be on sale and the least likely season to be on sale is Summer.
Example of one of the calculation:
Brand: ASFP
Dummy Variables: ASFP=1, ASLL=0, PFP=0
I= 0.57927 -0.03786(ASLL)-0.32430(PFP)-0.05008(Spring)+0.22334(Summer)-0.22437(Winter) = 0.57927-0.05008(Spring)+0.22334(Summer)-0.22437(Winter)=
0.52186
Q3: Determine if ASLL and PFP are equally likely to be on sale at 99% confidence.
Since the p-value is less than 0.01, we can reject the null hypothesis at 99% confidence.
Conclusion
From our analysis, we found, as the price of a brand goes up, the demand drops. The price elasticity is different for each brand. ASFP and ASLL were similar in price elasticity at -1.92, whereas PFP was more negatively elastic at -2.98.
We found that sales have an impact on demand. The sales variable had a low P-Value at the 95% confidence interval indicating significance. However, the overall model has a very low R squared which should be accounted for. When adding dummy variables for each brand, it was concluded that brand ASFP is the only brand that sees a decrease in demand when items are on sale.
With the season staying constant, the brand with the highest probability of being on sale is ASFP. In addition, the season with the highest probability of a brand on sale is the winter.
At a 99% confidence interval, ASLL and PFP are equally likely to be on sale.
Concerns
When running a regression on a sales impact on demand, we noticed that the model had a very low R-Squared. The variables came back significant, but not the model could be stronger. When adding dummy variables, the model again had a low R squared, but the variables again were significant at a 95% confidence interval. The low R-squared is something to note and account for when analyzing data.